The International Association SEIA (more than 1000 member companies) has published the results of a large-scale study of the solar energy industry in the United States. Based on the results of the work, the results of its further development were predicted and two important conclusions were made. First, the industry has shown stable, diversified and sustainable growth over the past 20 years. Second, solar energy is booming in the United States.
In this article, we summarized the main information of the study and accompanied it with visual graphs. More detailed information can be found on the Association’s official resources page, incl. slide presentations, and much more.
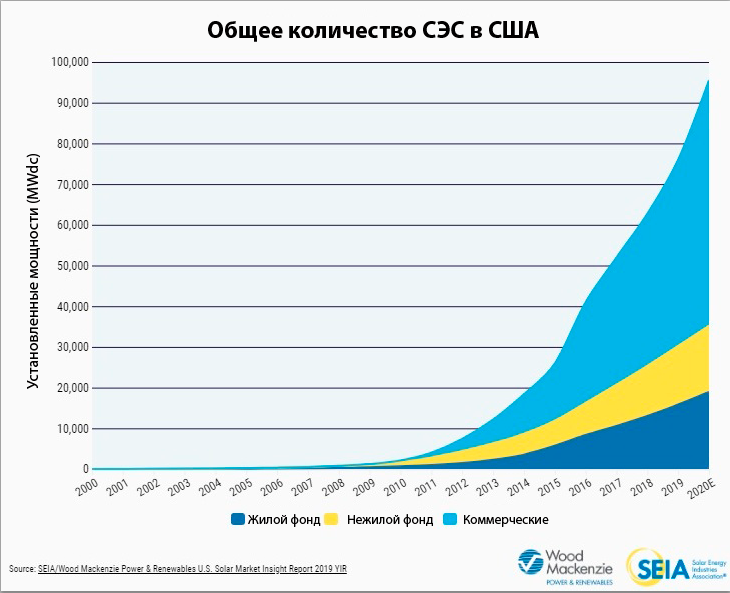
The explosive growth of the last “solar decade”
The average annual growth rate of PV (solar energy) in the United States in the last decade alone was 48%.
This result was achieved thanks to strong federal policies, including:
- tax credit for investments in SE;
- rapid cost reduction;
- growing demand in the private and public sectors for clean electricity,
the country currently has nearly 78 GW of solar capacity installed, enough to power 14.5 million homes.
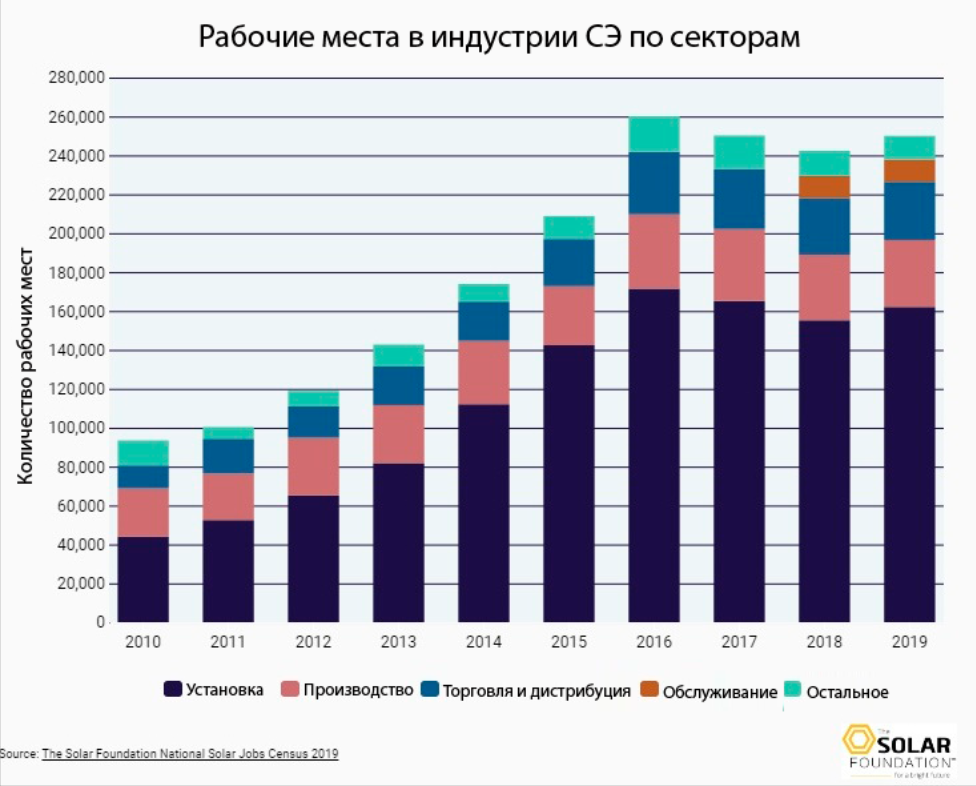
Solar energy as a driver of the economy
Today, nearly 250,000 Americans work in SE, more than double the number in 2012. In 2019, the solar industry contributed $18 billion to the US economy. investment.
The growth of solar energy is driven by falling prices
A few facts:
- the cost of installing solar panels has fallen by more than 70% over the past decade, leading to the construction of thousands of new stations across the country;
- the average price of SPP for an American country house has fallen from $40,000 to $18,000 in 10 years;
- the cost of electricity from traditional sources in the US ranges from 16 to 35 cents per 1 kW, which makes solar energy more profitable.
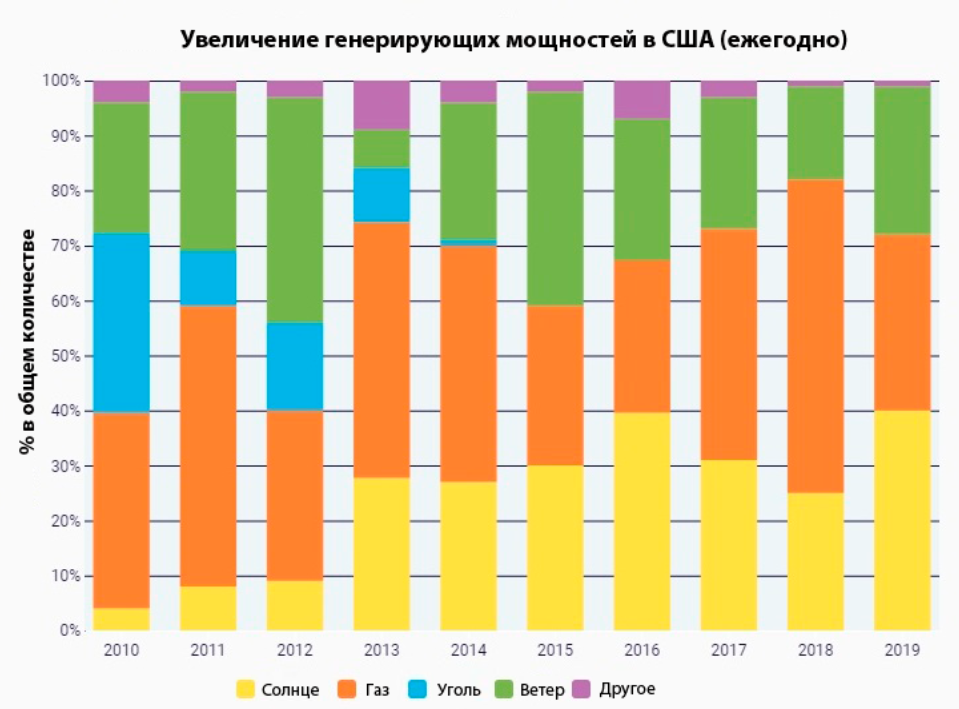
The share of solar generation has grown dramatically
SE consistently occupies the 1st or 2nd place in terms of the number of introduction of new energy capacities in each of the last 5 years. In 2019, 40% of all new electrical capacity added to the grid came from solar power, the highest in history. PV’s increased competitiveness relative to other technologies has enabled it to rapidly increase its share of total US electricity generation by a factor of 25, from 0.1% in 2010 to 2.5% today.
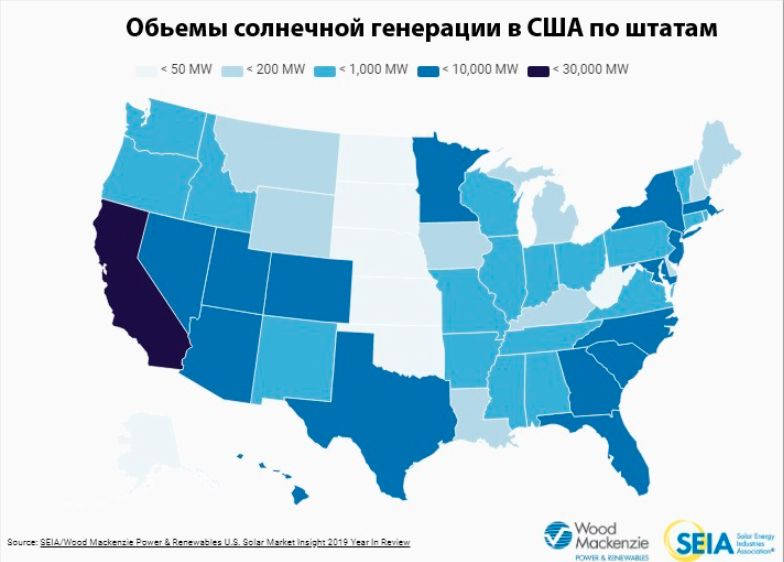
US solar industry – 50-state market
Although the US solar market has traditionally been dominated by California, other markets continue to expand rapidly as well. In 2019, states outside of California accounted for the largest market share in a decade, thanks to rapid growth in Florida and Texas. As the price of solar cells continues to fall, new market entrants will capture an increasing share of the national market.

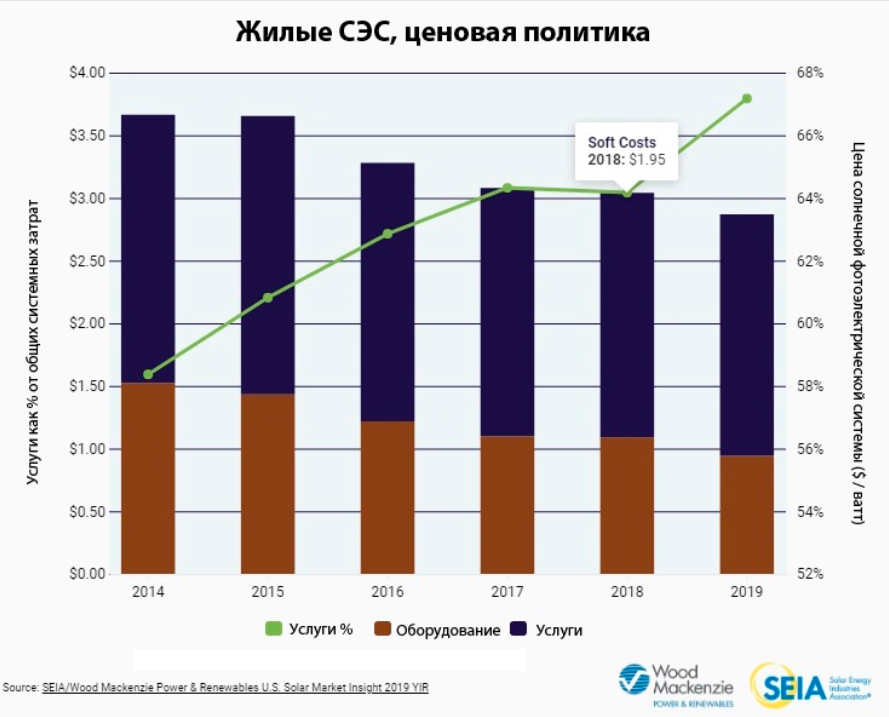
Solar roof prices could drop even faster
The biggest opportunity for cost savings in the overall cost of residential and small commercial solar projects lies in the service area, not the price of the panels themselves:
- issuance of permits;
- verification and connection;
- shortening the supply chain;
- customer acquisition, etc.
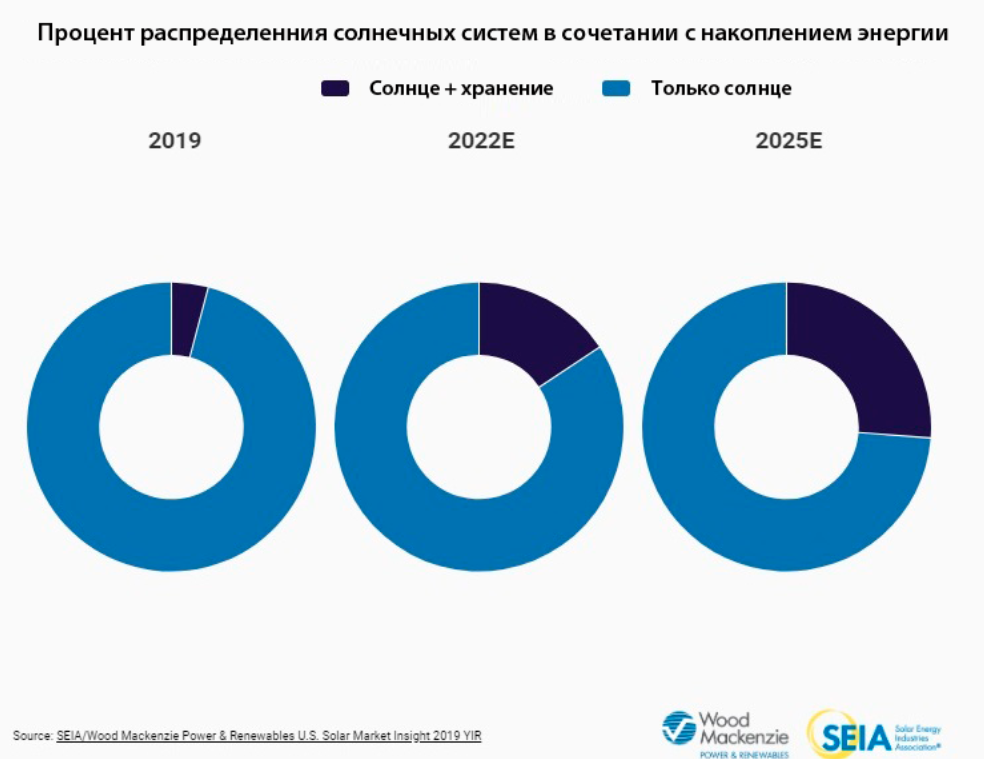
Combining panels and batteries into a single system
Homeowners and businesses are increasingly opting for solar panels that are connected to the battery. It is expected that such solar power plants will make up more than 25% of stations by 2025 against 5% in 2019.
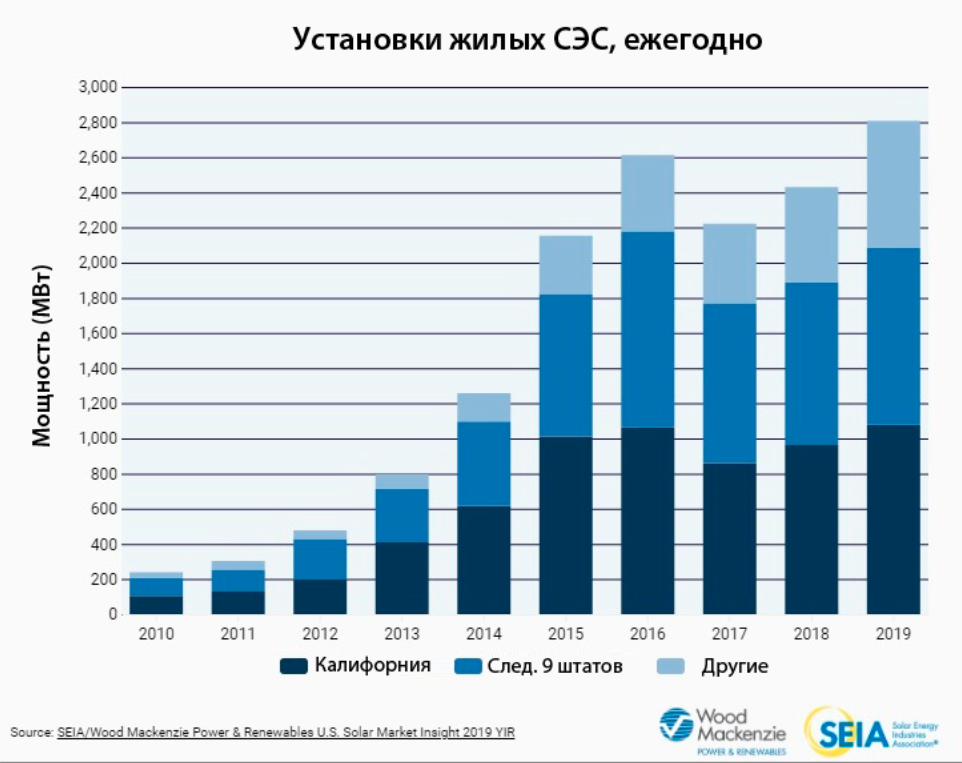
Continued territorial diversification of the residential market
2019 was a record year for the solar roof residential market. Previously, about 90% accounted for California, Texas and other states from the TOP-10. Today, the share of the remaining non-top 10 states has risen from 10% to more than 25%.
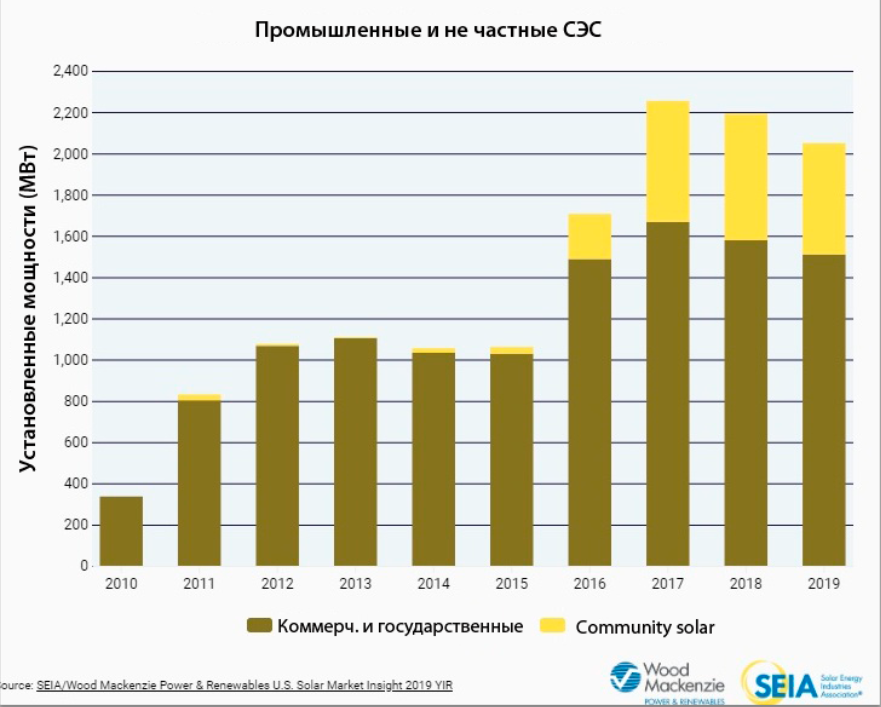
Installation of solar panels by corporate companies
The rapid growth of solar energy in recent years has led to an increase in the non-residential segment with solar roofs. First of all, the number of such rooftop installations has grown at companies such as Walmart, Apple, Target and Amazon. Both segments are expected to continue to grow in the future.
“Solar locomotive” continues to pick up speed
Some confusion over the change in “green tariffs” in the United States over the past two years has led to a partial slowdown in the introduction of new private stations. However, already in the 4th quarter of 2019, the capacities of this share of generation increased by 8 MW at once, bringing the total figure for the country to a record 48.1 GW.
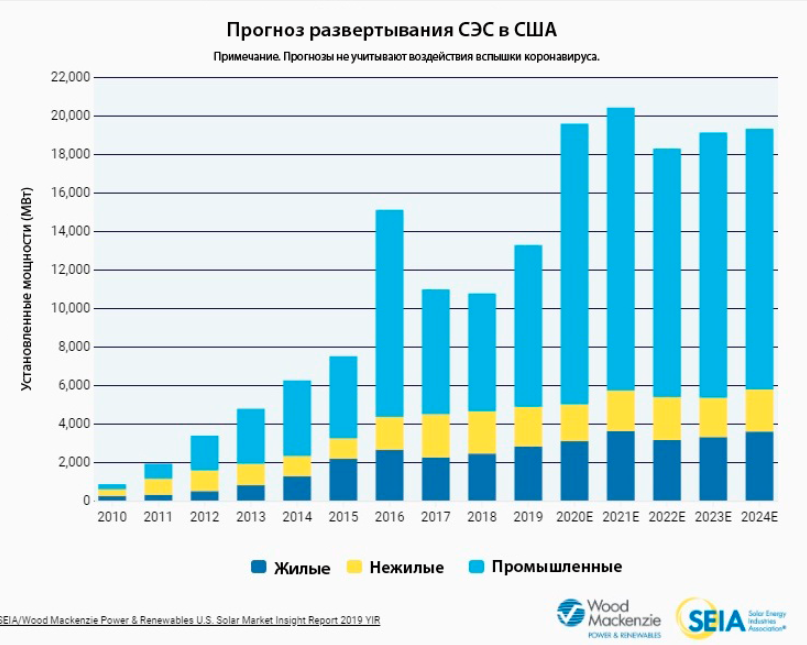
Solar Growth Forecast
After a 2% market drop in 2018 due to the impact of modular tariffs on utility project development times, growth resumed in 2019 with over 13 GW installed. Based on forecasts developed prior to the coronavirus outbreak, installs were projected to grow across all market segments in 2020 and 2021 as prices fall and developers accelerate buildup in anticipation of a lower investment tax credit. Over the next 5 years, the total installed capacity is expected to more than double, and by 2021 the total use should exceed 100 GW.
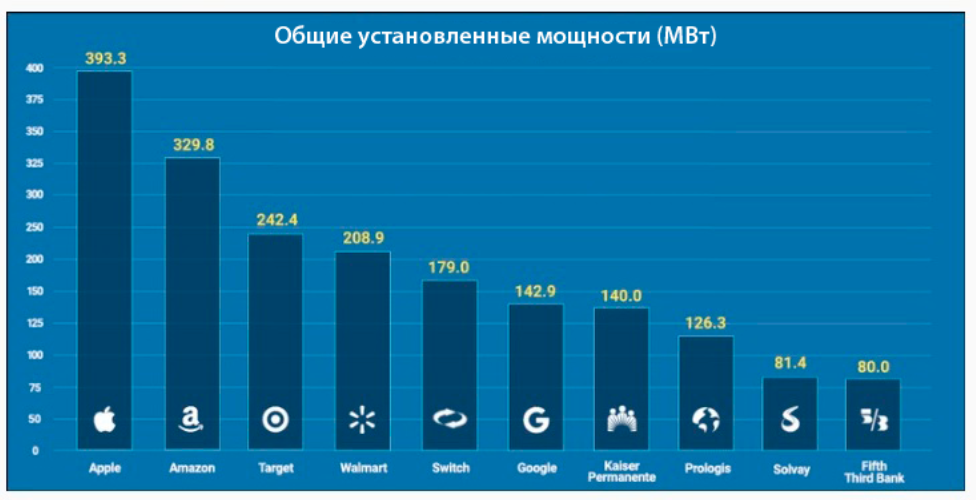
SE Helps Top 500 Companies Save Money
Data from the annual SEIA Solar Means Business report shows that major US corporations including Apple, Amazon, Target and Walmart are investing in solar and renewable energy at an incredible rate. By 2018, America’s leading corporate solar users had installed more than 7,000 MW of capacity at more than 35,000 different sites across the country.
Other key takeaways:
- 2018 was the second year in terms of the number of commercial solar installations with an installed capacity of 1144 MW.
- More than half of the 7 GW of corporate solar capacity has been installed in the past three years.
Click the link provided to view the SEIA Solar Means Business report, including interactive maps and data processing tools for the top US solar corporate users.