Logic and “cruel” reality
So, the task arose to move from empirical conclusions in the field of solar energy to mathematical ones. First, some theory:
First you need to decide on our energy source in a mathematical form, namely, to find out how much power the Sun can give in the ideal case. It is known from reference sources that if we take a plane with an area of 1 sq. meter and send it to the Sun in orbit of the Earth, then it will transfer about 1.4 kW of power to it. This number is called the solar constant, and it means that on our planet we will not take more energy than this value with all our desire.
Logic dictates that we can remove the maximum power at the equator, and the minimum at the pole.
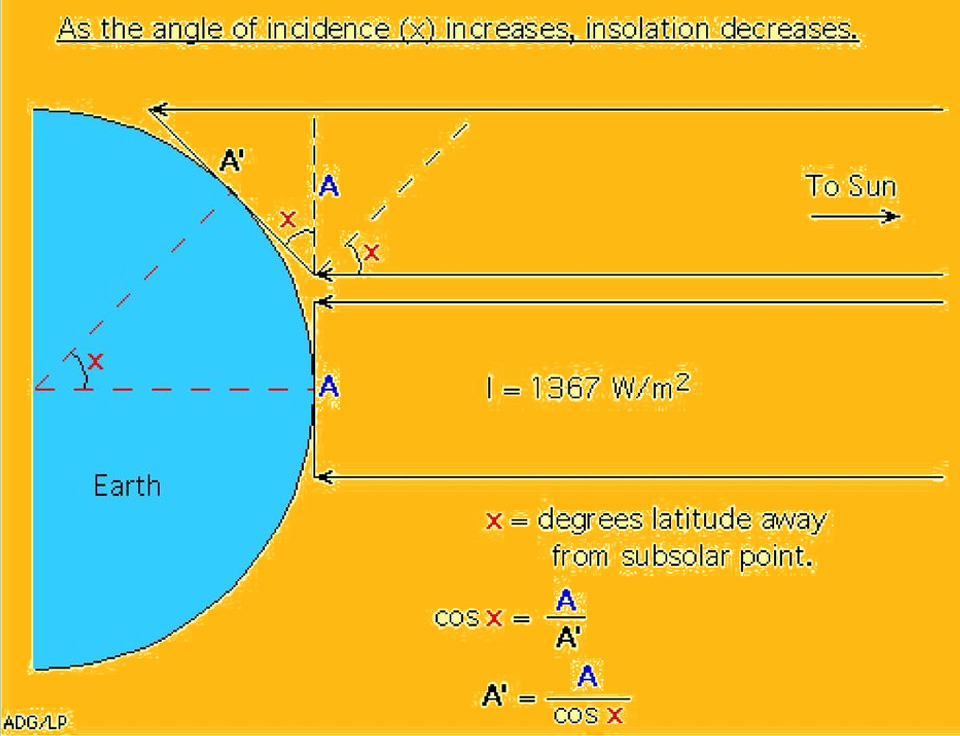
It can be seen from the drawing that up to an angle of 45 degrees, the power will change slightly, and after that it will sharply decrease due to the sphericity of the surface. One could even calculate these changes as a percentage, but here we are faced with a cruel reality – in fact, the radiation of the Sun does not correspond to geometric constructions, but behaves in a strange way:
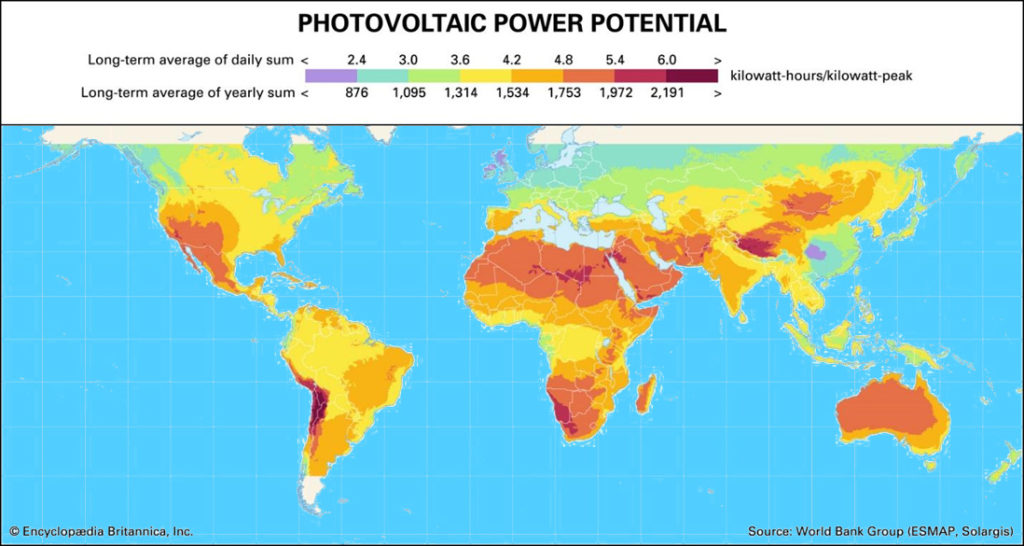
From the map of the potential of the Earth’s photovoltaic energy, it can be seen that the most profitable zones for the operation of solar power plants are not on the equator, but along the Southern and Northern tropics, which corresponds to approximately 20 degrees of latitude in both hemispheres, and solar radiation is not so strong at the equator. This fundamentally changes the original intention to calculate radiation using geometric constructions, since the real state of affairs does not correspond to the theoretical one. In addition, it becomes obvious that it is pointless to be tied to latitude – it is clear that in China at the same latitude there are zones with both maximum solar radiation and minimum. Or, for example, in Chile – excellent conditions, but literally nearby in Brazil, at the same latitude – very mediocre.
The reason for this lies in the properties of the atmosphere and the reflectivity of the surface of the planet.
If in orbit we are dealing with a simple point source of light, then on the surface of the Earth it is divided into three components. The radiation itself from the sun, plus the glow of the atmosphere, plus the reflected light from the surface of the earth. And these factors are so significant that they completely distort the original geometric model.
Example of Turkmenistan
Scientists and specialists in solar energy faced this problem for a long time, as a result, special scientific stations were organized that collected data on all types of radiation around the clock for several years.
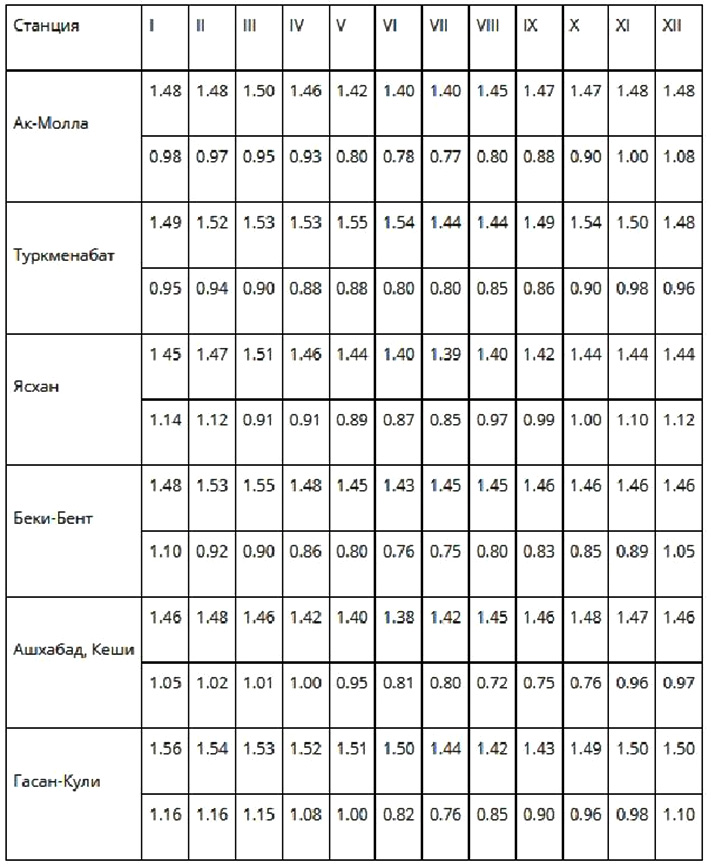
Here, for example, a few years ago, the problem of solar energy was taken care of in Turkmenistan, as a result, large studies were carried out in various regions of the country:
Extreme values of the intensity of direct radiation to a perpendicular surface (cal/cm min) on cloudless days at 12:30 pm (the first line is the maximum, the second line is the minimum)
The data was summarized in a voluminous work, replete with formulas, where there are more sines than letters, here is a small fragment:
“and the total intensity of solar radiation with a complete orientation of the surface is determined by dependence (42):

where IM, IP are the intensities of direct solar radiation, corresponding to expressions (15), (16). In fact, this ensures maximum solar energy per unit surface area. The average daily or average monthly value of the solar radiation intensity for a completely oriented surface is represented as (43)
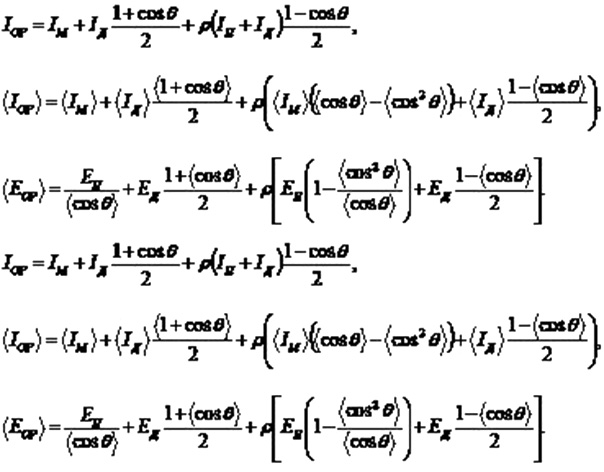
The average long-term daily arrival or monthly arrival of solar energy on a completely oriented surface EOP is determined according to the rules (38) and is equal to
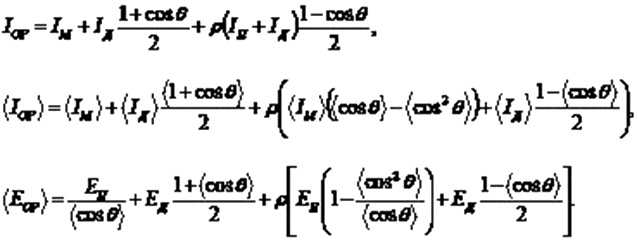
The average long-term annual inflow of solar energy is the sum of the average long-term daily or monthly inflows. Distribution in Turkmenistan of the average long-term annual sum of direct solar radiation energy arrivals on the surface normal to the beam and the highest value of solar energy income per unit surface is from 6000 to 6800 MJ/m2[5-7,9-13,19] .”
And so on, many, many pages.
Calculation with ready studies
From which it follows that we will not be engaged in independent calculations in order to find the mysterious coefficient, but we will try, for example, to use the ready-made results of NASA research from 1983 to 2005:
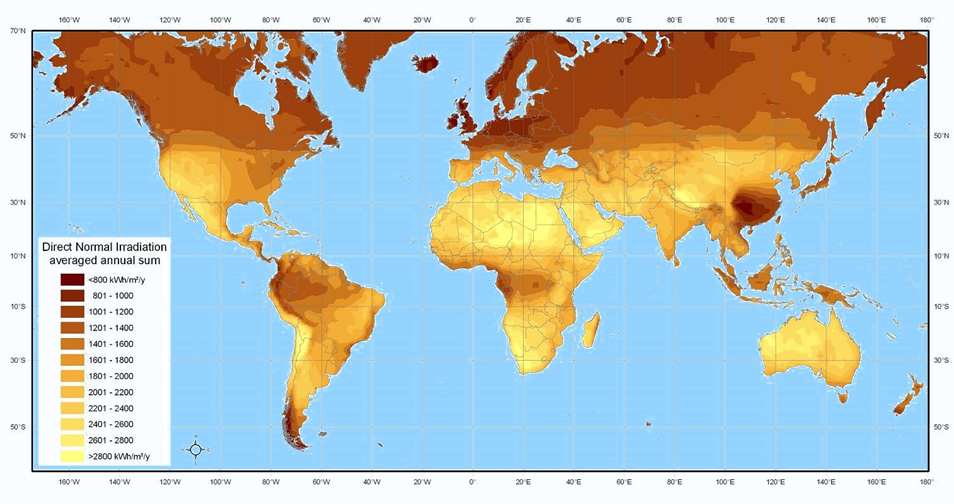
Solar radiation indicators are expressed in kW\h\y, which means kilowatt-hours on average per year.
Now let’s turn to more detailed data. Let’s take Spain for example.
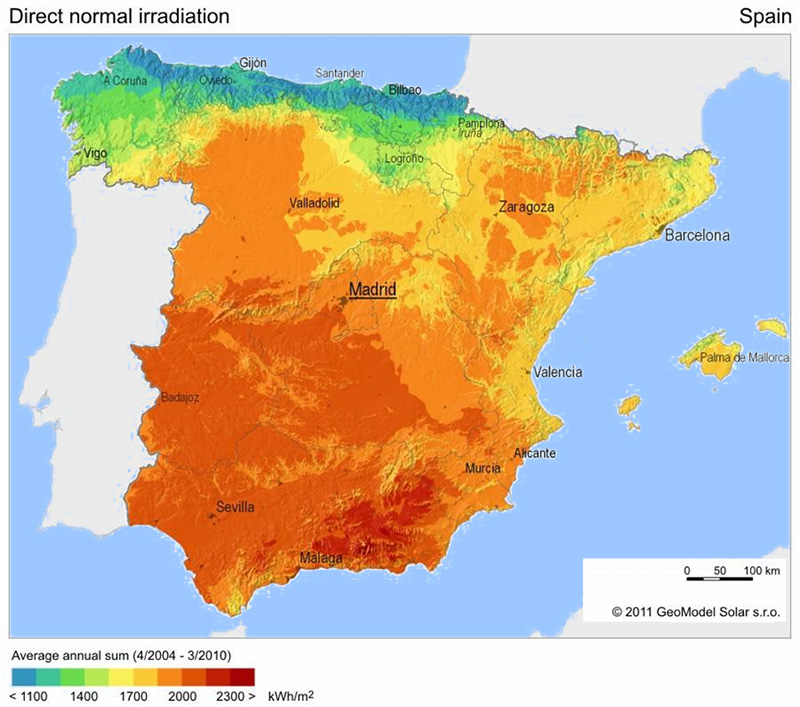
Here are the results of the analysis of solar radiation, taken over a period of 7 years, specifically for the needs of solar energy.
Let’s try to calculate now. For example, we install solar panels in the city of Santander. Approximately 1200 kilowatt-hours can be collected there in a year. We divide by 365 and get the average annual solar radiation power in the region of 4 kWh per 1 square meter. Then we divide by 24 hours. It turns out about 160 watts per square meter.
For interest, let’s compare the maximum ideal annual radiation in orbit:
1.4 kWh/ m2 x (24 h/day) = (33 kWh/ m2 )/day
(33 kWh / m 2 ) / day x (365 days / year) \u003d (12000 kWh / m 2 ) / year.
Which is exactly 10 times more than in Santander!
Country information is available at this link.
https://solargis.com/maps-and-gis-data/download/ukraine
https://solargis.com/maps-and-gis-data/download/belize
And here is a search by topic:
https://www.google.com/search?client=firefox-b-d&q=CPS+Potential+by+Country